
In addition, Insights reports can be reordered using the click-and-drag six-dot icon, allowing you to customize the dashboard layout to match what matters most to you.
What Are Insights?
Insights are interactive reports and summary cards that surface real-time data from across the platform. They help you quickly understand trends, performance, and opportunities without needing to navigate into individual projects or reports.
With Insights, you can:
-
Monitor lead and project activity
-
Track estimates, bookings, and conversions
-
Review financial performance and profitability
-
Understand order and invoice status at a glance
Customizing Your Dashboard Layout
Each Insight report includes a six-dot (drag) icon.
To reorder Insights:
-
Click and hold the six-dot icon on a report.
-
Drag the report to your preferred position on the dashboard.
-
Release to save the new layout.
This allows you to prioritize the metrics that are most important to your workflow.
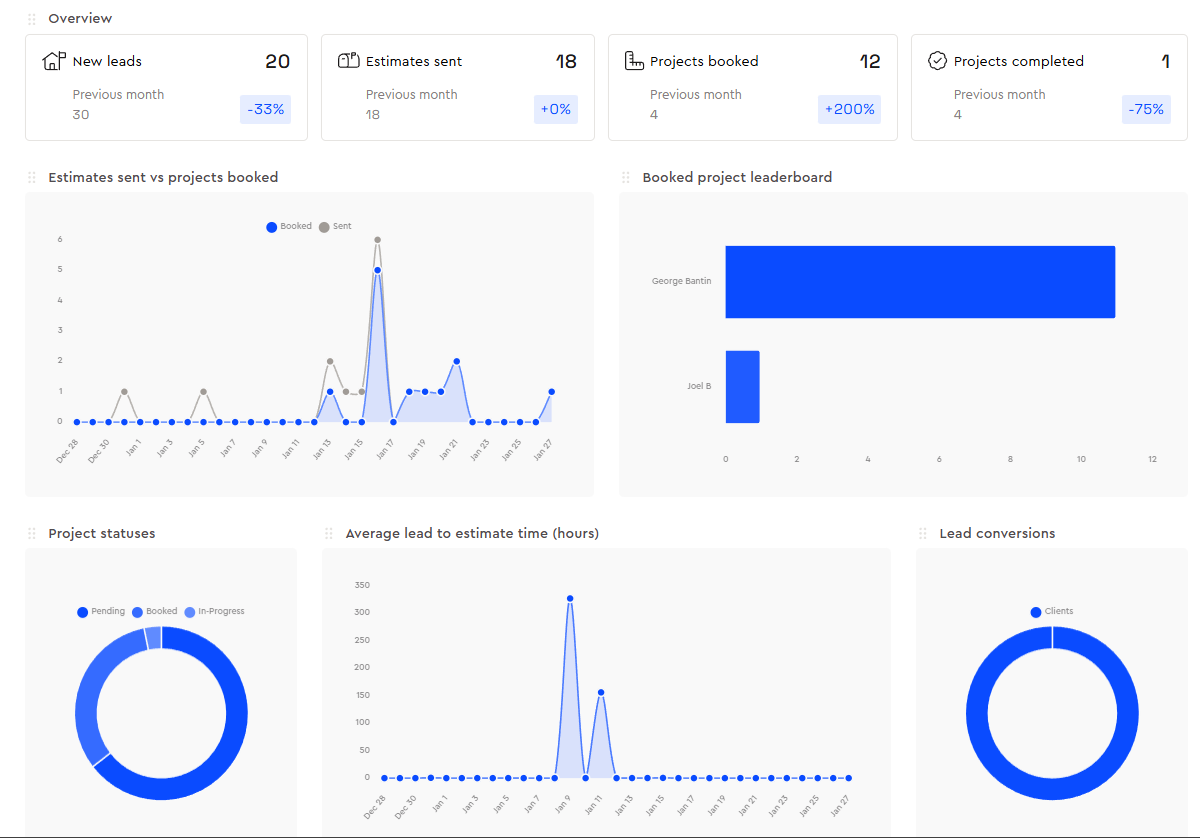
Overview Metrics
At the top of the dashboard, overview cards provide quick, high-level performance indicators:
-
New Leads – Number of new leads created
-
Estimates Sent – Total estimates sent
-
Projects Booked – Projects converted from estimates
-
Projects Completed – Completed projects
Each card also shows a comparison to the previous month.
Lead & Sales Performance Insights
Estimates Sent vs Projects Booked
-
A time-based chart comparing estimates sent against projects booked, helping you visualize conversion trends over time.
Lead Generation Leaderboard
-
Displays which team members are generating the most leads.
Lead Conversions
-
Shows how leads convert into clients, providing insight into sales effectiveness.
Booked Clients by Lead Source
-
Breaks down booked vs unbooked clients by lead source, helping identify which channels perform best.
Average Lead to Estimate Time (Hours)
-
Tracks how long it takes, on average, to move a lead to an estimate—useful for identifying delays in your sales process.
Project & Production Insights
Project Statuses
-
Visual breakdown of projects by status, such as pending, booked, and in progress.
Booked Project Leaderboard
-
Ranks team members based on the number of projects booked.
Financial Insights
Financial Overview Cards
-
Value Sent – Total value of estimates sent
-
Value Booked – Total value of booked projects
-
Average Project Value
-
Average Profit
Each metric includes a comparison to the previous month.
Top Booked Projects
-
Highlights your highest-value booked projects.
Booked Project Profit vs Cost
-
Compares profit against cost to give a clear view of margins.
Labor vs Material Costs
-
Shows the cost split between labor and materials across projects.
Total Project Value Leaderboard
-
Ranks team members by total project value (sent vs booked).
Average Project Value Leaderboard
-
Compares average project values by team member.
Average Project Value by Lead Source
-
Shows which lead sources generate the highest-value projects.
Orders & Invoicing Insights
All Orders
-
Displays total order value with a breakdown of work orders and purchase orders.
Purchase Orders
-
Shows purchase order totals by status, including sent and approved.
Work Orders
-
Displays work order totals and their current status.
Invoice Values by Status
-
Breaks down invoice values by outstanding and other statuses, helping track receivables.
Summary
Insights turn your dashboard into a powerful decision-making tool by combining real-time metrics, visual reporting, and customizable layout controls. With full visibility into leads, projects, finances, and orders—and the ability to rearrange reports—you can keep your business performance front and center every time you log in.